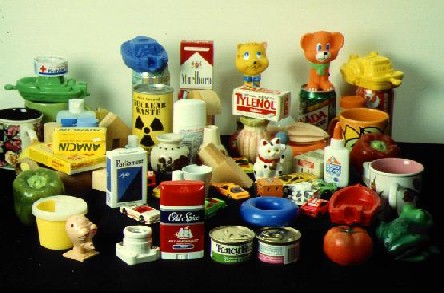
Real data of object images (COIL-100)
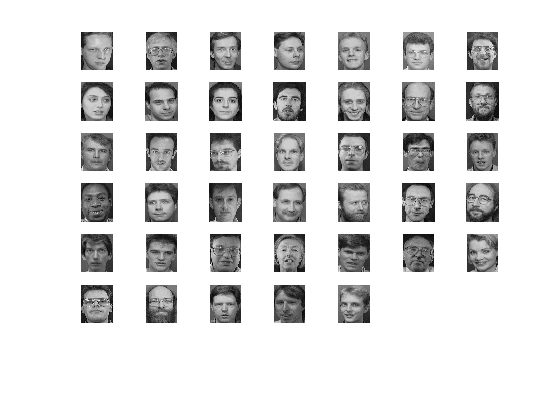
Real data of face images (ORL faces)
5.2. Real data without feature selection
|
Real data of object images (COIL-100)
|
Real data of face images (ORL faces)
|
EXPERIMENT 5
50 first objects from COIL-100 and FASTICA
objects=50;
nc=objects; %number of classes
np=20; %number of samples per class
n_vectors=10; %number of vectors used to reduce the data
nr=5; %number of repetitions of the classification process
per_test=0.5; %percentage of test samples from x (0-1)
>> example(3,1,0)
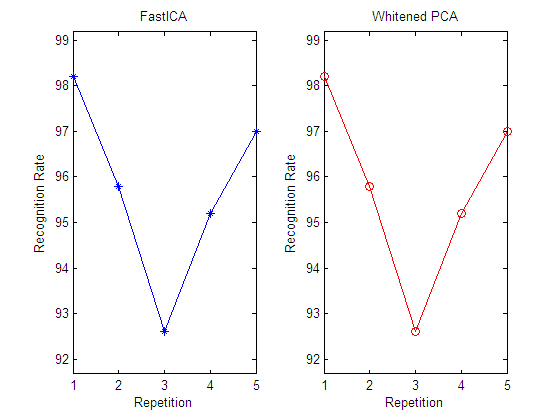
| Classifying...... REPETITION no. 1 FastICA Recognition rate:98.20 Whitening Recognition rate :98.20 REPETITION no. 2 FastICA Recognition rate:95.80 Whitening Recognition rate :95.80 REPETITION no. 3 FastICA Recognition rate:92.60 Whitening Recognition rate :92.60 REPETITION no. 4 FastICA Recognition rate:95.20 Whitening Recognition rate :95.20 REPETITION no. 5 FastICA Recognition rate:97.00 Whitening Recognition rate :97.00 For all the repetitions: FastICA Recognition rate:95.76 ± 0.94 Whitening Recognition rate :95.76 ± 0.94 |
EXPERIMENT 6
50 first objects from COIL-100 and INFOMAX
objects=50;
nc=objects; %number of classes
np=20; %number of samples per class
n_vectors=10; %number of vectors used to reduce the data
nr=5; %number of repetitions of the classification process
per_test=0.5; %percentage of test samples from x (0-1)
>> example(3,2,0)
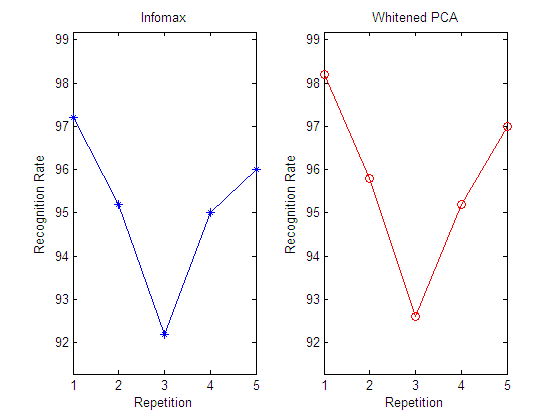
| Classifying...... REPETITION no. 1 Infomax Recognition rate:97.20 Whitening Recognition rate :98.20 REPETITION no. 2 Infomax Recognition rate:94.80 Whitening Recognition rate :95.80 REPETITION no. 3 Infomax Recognition rate:91.60 Whitening Recognition rate :92.60 REPETITION no. 4 Infomax Recognition rate:94.40 Whitening Recognition rate :95.20 REPETITION no. 5 Infomax Recognition rate:96.00 Whitening Recognition rate :97.00 For all the repetitions: Infomax Recognition rate:94.80 ± 0.94 Whitening Recognition rate :95.76 ± 0.94 |
EXPERIMENT 7
40 people from ORL and FASTICA
objects=40;
nc=objects; %number of classes
np=10; %number of samples per class
n_vectors=10; %number of vectors used to reduce the data
nr=5; %number of repetitions of the classification process
per_test=0.5; %percentage of test samples from x (0-1)
>> example(4,1,0)
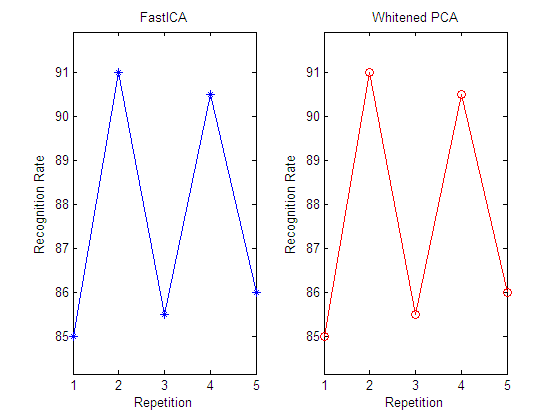
| Classifying...... REPETITION no. 1 FastICA Recognition rate:85.00 Whitening Recognition rate :85.00 REPETITION no. 2 FastICA Recognition rate:91.00 Whitening Recognition rate :91.00 REPETITION no. 3 FastICA Recognition rate:85.50 Whitening Recognition rate :85.50 REPETITION no. 4 FastICA Recognition rate:90.50 Whitening Recognition rate :90.50 REPETITION no. 5 FastICA Recognition rate:86.00 Whitening Recognition rate :86.00 For all the repetitions: FastICA Recognition rate:87.60 ± 1.30 Whitening Recognition rate :87.60 ± 1.30 |
EXPERIMENT 8
40 people from ORL and INFOMAX
objects=40;
x=data_orl_faces(objects);
nc=objects; %number of classes
np=10; %number of samples per class
n_vectors=10; %number of vectors used to reduce the data
nr=5; %number of repetitions of the classification process
per_test=0.5; %percentage of test samples from x (0-1)
>> example(4,2,0)
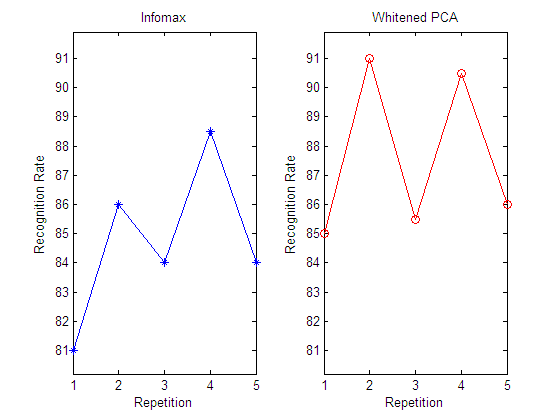
| Classifying...... REPETITION no. 1 Infomax Recognition rate:81.00 Whitening Recognition rate :85.00 REPETITION no. 2 Infomax Recognition rate:86.00 Whitening Recognition rate :91.00 REPETITION no. 3 Infomax Recognition rate:84.00 Whitening Recognition rate :85.50 REPETITION no. 4 Infomax Recognition rate:88.50 Whitening Recognition rate :90.50 REPETITION no. 5 Infomax Recognition rate:84.00 Whitening Recognition rate :86.00 For all the repetitions: Infomax Recognition rate:84.70 ± 1.24 Whitening Recognition rate :87.60 ± 1.30 |
CONCLUSIONS (Experiments 5-8)
From the results in the above experiments it is easy to see the equivalence between the whitened and the FastICA data.The recognition rate for these datasets is equal for both algorithms in each experiment. Infomax gives recognition rates which are somewhat different from those given by whitening, but the difference is relatively small.
MORE EXPERIMENTS (without feature selection)
The "example_loop.m" matlab function allows to run multiple experiments similar to those above, averaging the results.
The number of vectors used in the feature extraction process is an input parameter (vectors) which can take multiple values in order to show in a single run the recognition rates related to the number of vectors used for the transformation.
function
example_loop(data,objects, np,vectors,nr,see)
%data ---> 'coil' Images from COIL-100
% 'orl' Faces from ORL
%objects --> number of classes
%np ---> number of samples per class
%vectors----> array with the dimensions used to make the transformation
%nr ---> number of repetitions of the classification process
%see ---> seeing or not the plots: (NO ==> 0; YES ==> 1)
% For example: example_loop('coil',10,35,[2 4 6 8 10],10,0)
%%%%%%%%%%%%%% example_loop('coil',100,5,[2 4 6 8 10],10,0)
EXPERIMENT 9
10 first objects from COIL-100 and WHITENING, FASTICA and INFOMAX
>> example_loop('coil',10,35,[2 4 6 8 10],10,0)
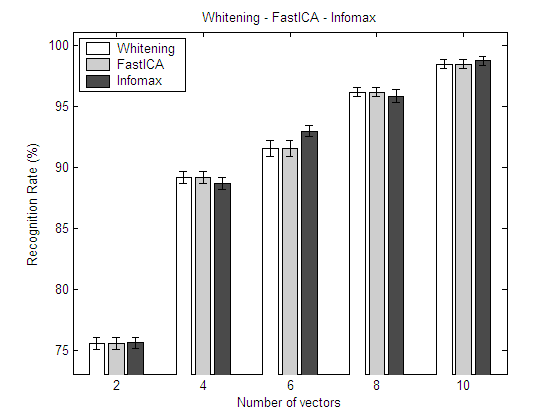
In this experiment, 10 objects from COIL-100 have been used with 35 views per object, and the (Whitening/FastICA/Infomax) transform has been computed for 2, 4, 6, 8 and 10 components. The classifier has been run 10 times (randomly selecting training and test sets).
The results show again the equivalence between the whitened and the FastICA data. As in the above experiments (exp. 5-8) Infomax gives slightly different recognition rates but almost equivalent. When the number of vectors used is 4 or 8, Infomax gives slightly lower recognition rates, but when the number of components is 6 or 10, Infomax gives higher rates than FastICA and Whitening. The plot shows the average results obtained after 10 repetitions. These results may vary if we use different data.
EXPERIMENT 10
100 objects from COIL-100 and WHITENING, FASTICA and INFOMAX
>> example_loop('coil',100,5,[2 4 6 8 10],10,0)
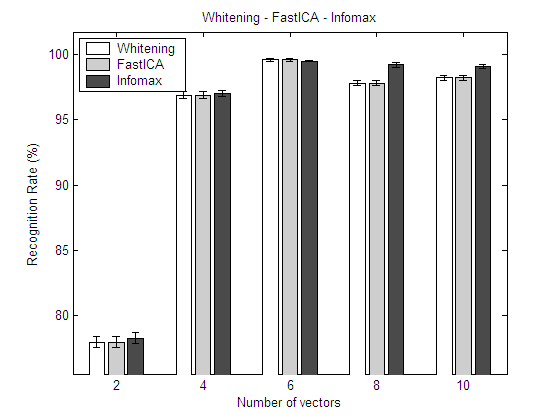
Now, the whole 100 objects from COIL-100 have been used with 5 views per object, and the (Whitening/FastICA/Infomax) transform has been computed for 2, 4, 6, 8 and 10 components. The classifier has been run 10 times (randomly selecting training and test sets).
The results are very similar to those of the previous experiment (exp. 9) .
When the number of vectors used is 6, Infomax gives slightly lower recognition rates, but when the number of components is 2, 8 or 10, Infomax gives higher rates than FastICA and Whitening. The plot shows the average results obtained after 10 repetitions.
The following experiments (11 and 12) offer similar conclusions with the ORL face database.
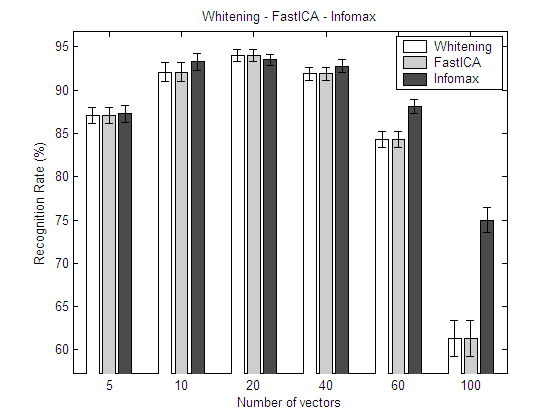
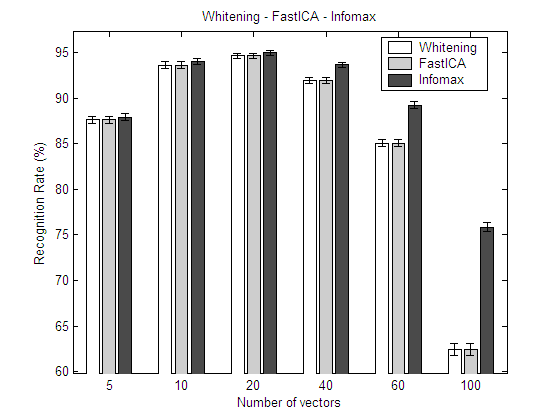
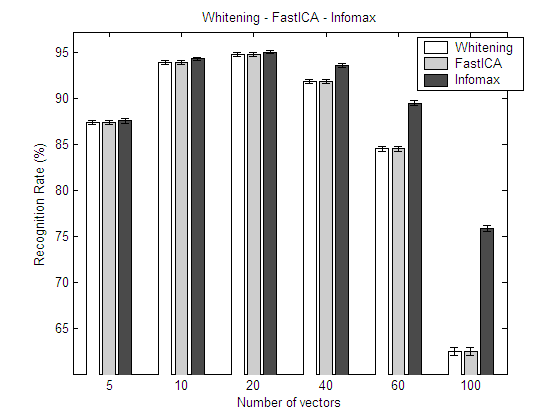
EXPERIMENT 11
20 people from ORL and WHITENING, FASTICA and INFOMAX
>> example_loop('orl',20,10,[5 10 20 40 60 100],10,0)
10 repetitions
>> example_loop('orl',20,10,[5 10 20 40 60 100],50,0)
50 repetitions
>> example_loop('orl',20,10,[5 10 20 40 60 100],100,0)
100 repetitions
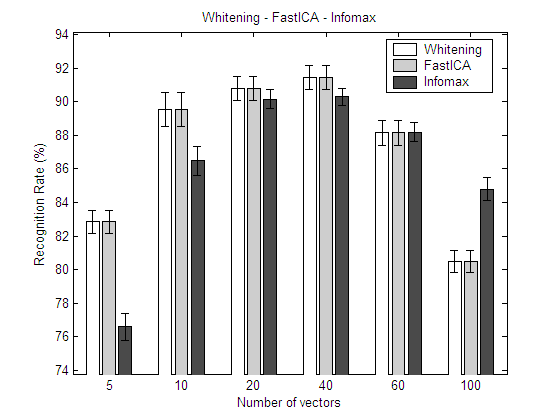
EXPERIMENT 12
40 people from ORL and WHITENING, FASTICA and INFOMAX
>> example_loop('orl',40,10,[5 10 20 40 60 100],10,0)
10 repetitions
>>example_loop('orl',40,10,[5 10 20 40 60 100 120 140 160 180 200],10,0)
10 repetitions
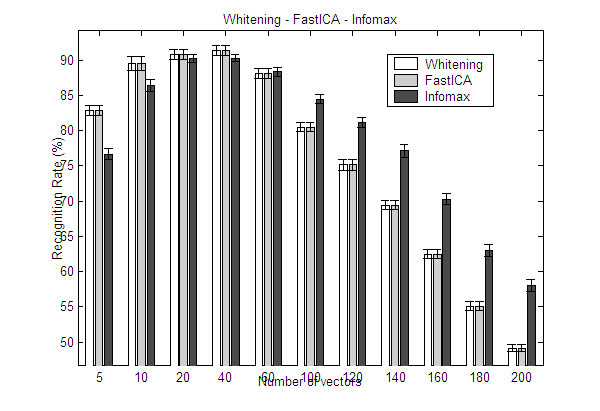
In this last graph, for a number of components ranging
from 5 to 200, the average and standard deviation of 10 repetitions of the same experiment are shown.From these results, it becomes clear that FastICA and whitened PCA perform equally, and that Infomax shows some differences. These differences are more clear when the number of components used is either very low or very high. Particularly, when the number of components is very high, the recognition rates obtained by Infomax are clearly better than those of FastICA or whitened PCA.
Although these good results are found when the number of components is far from the optimum in terms of recognition rates, they deserve a further study in order to find an explanation, which may be related to the lack of orthogonality of the components returned by Infomax.